Introduction: Why TCO Matters in Material Handling
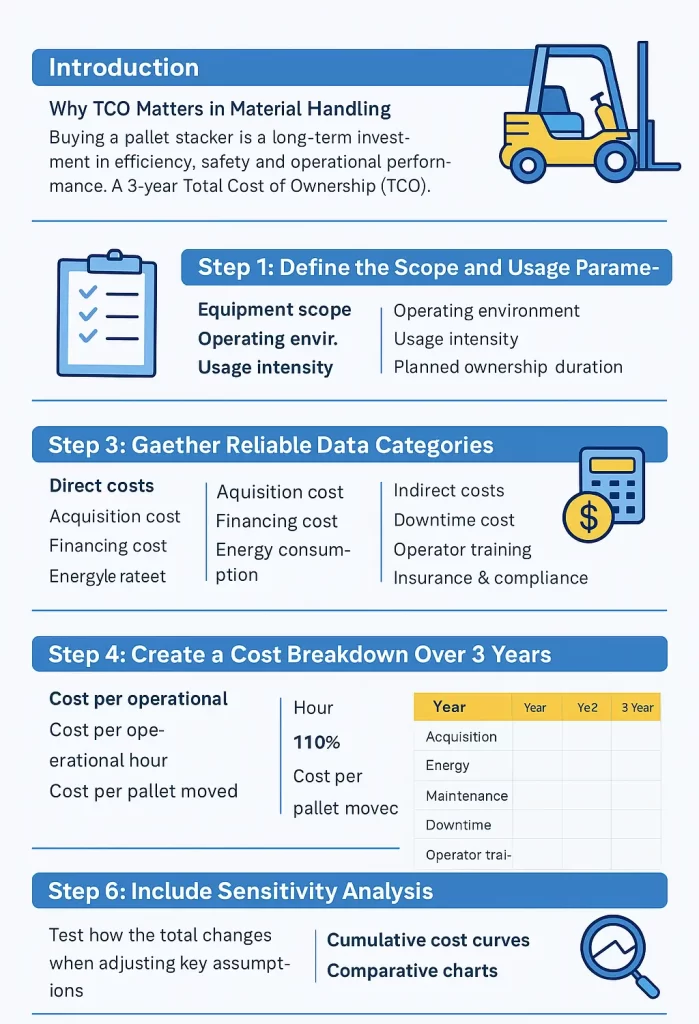
Buying a pallet stacker is more than a one-time purchase—it’s a long-term investment in operational efficiency, safety, and operational performance. Yet, many businesses underestimate the true cost of ownership by focusing only on the purchase price.
A 3-year Total Cost of Ownership model for pallet stackers helps you uncover the complete financial impact of your pallet stacker fleet. It factors in not just acquisition costs, but also energy, maintenance, downtime, and residual value—giving you a data-driven view of ROI and lifecycle cost efficiency.
In this guide, we’ll walk you step-by-step through building a 3-year TCO model tailored for pallet stackers, helping you make smarter procurement and budgeting decisions.
Step 1: Define the Scope and Usage Parameters
Before you crunch numbers, define what you’re modeling and under what conditions. Start by outlining:
- Equipment scope: Will this model cover one type of pallet stacker or your entire fleet?
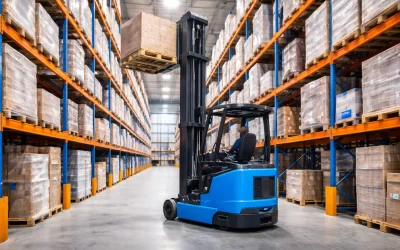
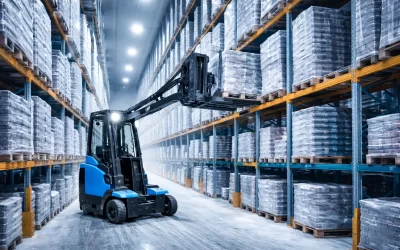
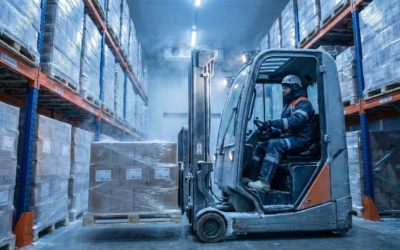
- Operating environment: Indoor warehouse, cold storage, or mixed conditions?
- Usage intensity: Number of shifts, average hours of operation per day, and expected workload (e.g., average load weight, lift height).
- Planned ownership duration: In this case, 3 years—but clarify whether this includes an option to extend or replace earlier.
These inputs shape the assumptions for your cost components and directly affect how realistic your Total Cost of Ownership model for pallet stackers will be.
Step 2: Identify the Major Cost Categories
A robust Total Cost of Ownership model for pallet stackers goes beyond the sticker price. You’ll want to break costs into direct and indirect components for accuracy.
A. Direct Costs
These are quantifiable and predictable:
- Acquisition cost: Purchase or lease cost, including taxes, delivery, and setup.
- Financing cost: If financed, include interest or leasing fees.
- Energy consumption: Electricity (for electric stackers) or fuel (for diesel/LPG units).
- Maintenance & servicing: Preventive maintenance, spare parts, lubricants, and service contracts.
B. Indirect Costs
These are harder to see but impact your bottom line:
- Downtime cost: Lost productivity during repairs or battery charging.
- Operator training: Time and expense to train or certify operators.
- Insurance & compliance: Safety certifications, insurance premiums, and compliance costs.
- Depreciation & resale value: The projected loss in asset value over 3 years.
By categorizing costs this way, you can model not just cash flow, but operational performance over time.
Step 3: Gather Reliable Data Inputs
Total Cost of Ownership model for pallet stackers live or die by the quality of their data. Collect data from:
- OEM or dealer specs – acquisition costs, service intervals, power consumption rates.
- Historical operational data – maintenance logs, repair frequency, and downtime.
- Energy rate sheets – cost per kWh or fuel unit.
- Finance department – interest rates, lease terms, insurance costs.
- Used equipment market – estimated resale or residual value after 3 years.
You can use average market benchmarks to fill data gaps, but flag any estimates so stakeholders understand the model’s assumptions.
Step 4: Create a Cost Breakdown Over 3 Years
Now, translate your data into a timeline of annual costs. A 3-year TCO table might look like this:
| Cost Category | Year 1 | Year 2 | Year 3 | Total (3-Year) |
| Acquisition | $12,000 | – | – | $12,000 |
| Energy | $1,500 | $1,500 | $1,500 | $4,500 |
| Maintenance | $400 | $600 | $800 | $1,800 |
| Downtime | $300 | $350 | $400 | $1,050 |
| Operator Training | $500 | – | – | $500 |
| Insurance | $250 | $250 | $250 | $750 |
| Residual Value | – | – | ($3,000) | ($3,000) |
| Total TCO | $14,950 | $2,700 | ($50) | $17,600 |
Tip: Always present TCO both as an absolute value and as a cost per operational hour to enable fair comparison across different equipment.
Step 5: Factor in Utilization Efficiency
To compare models or brands, normalize your TCO by usage metrics:
- Cost per operational hour
TCO÷total hours used in 3 years\text{TCO} ÷ \text{total hours used in 3 years}TCO÷total hours used in 3 years - Cost per pallet moved
TCO÷total pallets handled\text{TCO} ÷ \text{total pallets handled}TCO÷total pallets handled
This converts raw financials into operational performance metrics, allowing you to identify which equipment delivers the lowest total cost per output unit.
Step 6: Include Sensitivity Analysis
Your TCO model should be flexible enough to handle “what-if” scenarios. Test how the total changes when you adjust key assumptions:
- Energy costs +10% → How does total TCO shift?
- Maintenance frequency doubles → What’s the new break-even point?
- Shorter usage lifecycle (2 years) → Does leasing outperform buying?
Sensitivity analysis helps reveal hidden cost drivers and supports procurement negotiations with solid, data-backed reasoning.
Step 7: Visualize and Interpret the Results
Once the model is built, use data visualization to make the results clear and actionable. Include:
- Stacked cost breakdowns – to show where your largest expenses lie.
- Cumulative cost curves – to visualize how total costs build over time.
- Comparative charts – to compare multiple pallet stacker models or suppliers.
Decision-makers should be able to see not only total cost, but also the cost structure—helping them target areas for savings (e.g., energy optimization or maintenance scheduling).
Step 8: Use the TCO for Procurement and Budgeting
A well-built TCO model transforms how you evaluate suppliers and manage budgets:
- Procurement teams can use it to justify upfront costs with long-term savings.
- Finance teams can forecast depreciation and residual value for asset planning.
- Operations managers can optimize maintenance intervals to minimize downtime.
- Sustainability teams can measure carbon and energy cost efficiency over the lifecycle.
Total cost of ownership model for pallet stackers ensures decisions are strategic, not reactive—reducing risk and improving return on capital.
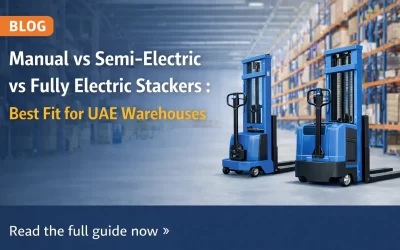
Example: Comparing Two Pallet Stackers
| Parameter | Model A (Electric) | Model B (Manual) |
| Purchase Price | $12,000 | $6,000 |
| Energy/Fuel | $4,500 (electricity) | – |
| Maintenance | $1,800 | $600 |
| Downtime Cost | $1,050 | $1,800 |
| Residual Value | ($3,000) | ($500) |
| 3-Year TCO | $16,350 | $7,900 |
At first glance, Model B seems cheaper—but if you account for productivity, speed, and labor efficiency, Model A’s higher upfront cost may deliver greater ROI.
Conclusion: Build TCO Models That Drive Smart, Sustainable Choices
Building a 3-year TCO model for pallet stackers isn’t just a financial exercise—it’s a strategic tool for optimizing your warehouse operations. By capturing every cost element and translating it into operational efficiency, you gain the insight needed to:
- Make data-driven equipment investments
- Extend asset lifecycles
- Optimize maintenance schedules
- Reduce energy and downtime costs
When used consistently, Total cost of ownership model for pallet stackers becomes the foundation for sustainable, cost-efficient material handling decisions—aligning finance, operations, and procurement under a shared performance metric.